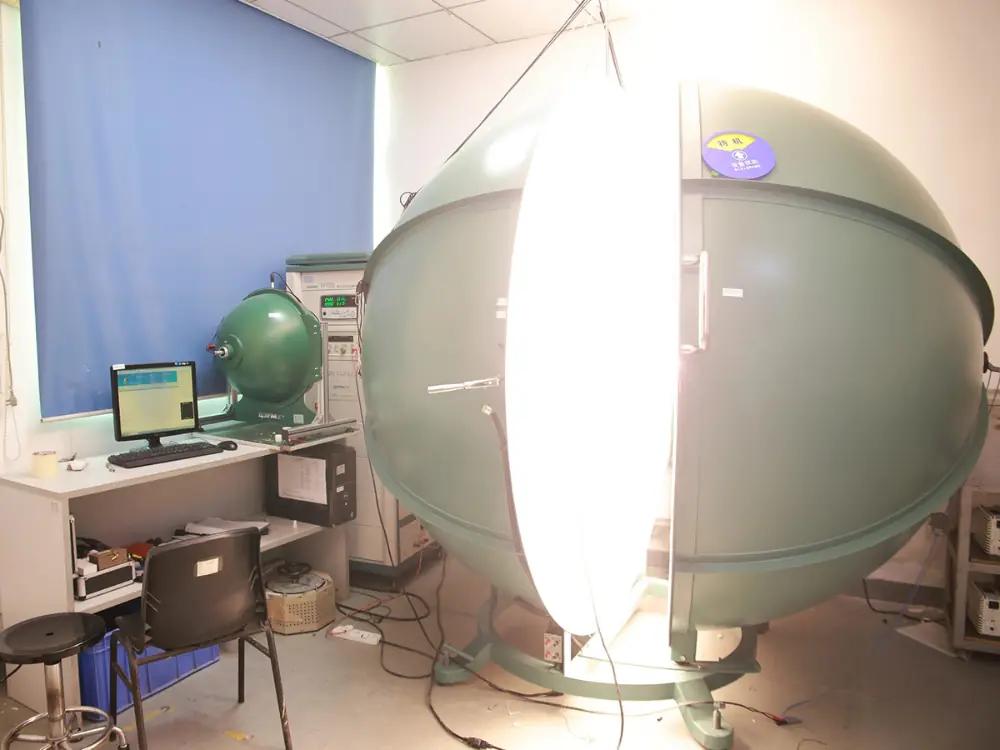
How to Read a Horticultural Lighting Test Report
Learn how to evaluate PPF, PPE, spectral distribution, PPFD maps, DLI, power quality and long-term performance before specifying a commercial grow light.
A horticultural luminaire can have an impressive wattage or peak PPFD value and still be the wrong choice for a commercial project. A defensible comparison starts with a complete test report, the exact tested configuration, and a clear separation between fixture output and light delivered to the crop canopy.
This guide explains the metrics a grower, lighting designer, distributor, or OEM buyer should verify before approving a grow light specification. It is intended as a procurement checklist, not as a substitute for a project-specific lighting plan or crop trial.
1. Start with the report identity, not the headline number
Before comparing performance, confirm that the report applies to the exact product being offered. Record the model number, LED and driver configuration, input voltage, dimming state, ambient conditions, test date, report number, and laboratory. If a product family contains different drivers or spectral options, ask which configuration represents the reported result.
The ASABE published-standards list identifies ANSI/ASABE S640 for horticultural radiation quantities and S642 for recommended measurement and testing methods. The DLC Horticultural Lighting Technical Requirements V4.0 also relies on standardized whole-fixture measurements and detailed reporting for products seeking listing.
2. PPF tells you total fixture output
Photosynthetic photon flux, or PPF, is the total rate at which a fixture emits photons in the photosynthetically active radiation range used by the stated method. It is reported in micromoles per second (μmol/s). PPF is an output quantity for the luminaire; it does not describe how evenly those photons reach a crop area.
Use PPF to compare total photon output only when the reports use the same wavelength range, test method, operating condition, and complete fixture configuration. Do not treat input watts as a substitute for PPF.
3. PPE connects photon output to electrical input
Photosynthetic photon efficacy, or PPE, is calculated as PPF divided by input power and is reported in micromoles per joule (μmol/J). It answers an electrical-efficiency question: how much reported photosynthetic photon output is produced for each joule consumed at the tested condition.
A higher PPE can reduce the electrical input needed for a given PPF, but it does not by itself prove better canopy uniformity, a more suitable spectrum, longer service life, or higher crop yield. DLC V4.0 uses a 2.5 μmol/J qualification threshold for listed products, but that program threshold should not be misrepresented as a universal crop-performance target.
4. Read the spectral distribution, not the phrase full spectrum
A spectral quantum distribution shows how photon output is distributed by wavelength. Review the graph together with reported photon-flux bands. Current DLC V4.0 reporting includes total 400–700 nm PPF, 400–500 nm, 500–600 nm and 600–700 nm bands, and far-red information for 700–800 nm where applicable.
For a tunable product, request data for the actual operating state. A spectrum measured with one channel setting cannot automatically represent every recipe, dimming state, or maximum-power configuration. Full spectrum is a marketing description unless it is accompanied by measured spectral data.
5. PPFD is an installation result, not another name for PPF
Photosynthetic photon flux density, or PPFD, describes the photon flux incident on a surface area and is reported in μmol/m²/s. A PPFD map should state mounting height, measurement plane, grid spacing, test area, fixture quantity, dimming level, and whether the values are measured or simulated.
Do not compare maps that use different areas or mounting heights as though they were equivalent. A single center-point PPFD value can hide weak edges and poor uniformity. For a commercial design, review the full grid and validate representative canopy points after installation.
6. DLI combines PPFD and time
Daily light integral, or DLI, is the total quantity of photosynthetically active photons delivered to a square meter during a day. When PPFD is constant, the calculation is:
DLI (mol/m²/day) = average PPFD (μmol/m²/s) × photoperiod (hours) × 3,600 ÷ 1,000,000
For example, an average PPFD of 500 μmol/m²/s maintained for 16 hours produces an electric-light DLI of 28.8 mol/m²/day. In a greenhouse, sunlight also contributes to total crop DLI, so a control strategy should account for daylight rather than operating the fixtures from a fixed wattage assumption.
7. Check long-term performance, electrical quality and safety
An initial PPF value is only one point in time. Ask how the manufacturer characterizes photon-flux maintenance, driver life, thermal conditions, and warranty terms. Confirm input-voltage range, power factor, total harmonic distortion, dimming behavior, inrush current, environmental rating, and the safety certification required for the installation market.
UL Solutions explains that horticultural equipment has application-specific concerns including photobiological exposure, damp or wet environments, ingress protection, wiring methods, PPF/PPE measurement and elevated operating conditions. See its horticultural lighting testing overview for the scope of these evaluations.
8. What a laboratory report cannot prove
A luminaire report does not guarantee crop yield, morphology, quality, energy savings, HVAC performance, or fixture layout. Those outcomes depend on the installed system and operating environment. Light intensity and spectrum interact with photoperiod, temperature, humidity, airflow, carbon dioxide, water, nutrients, crop genetics, and cultivation practice.
The U.S. Department of Energy notes that horticultural productivity depends on photon generation and delivery together with plant absorption and other critical growth inputs. Its Better Lighting for Agriculture resources provide useful context for evaluating system-level claims.
Commercial grow light report review checklist
- Exact model, LED package, driver, spectrum, voltage and dimming state match the offered product.
- Report number, date, laboratory and measurement method are identified.
- Input power, PPF and PPE are reported for the same operating condition.
- Spectral distribution and photon-flux bands are provided, including far-red when claimed.
- PPFD map states mounting height, area, grid, dimming level and measured or simulated status.
- Long-term photon-flux maintenance and warranty assumptions are documented.
- Power factor, THD, input range, controls, environmental rating and applicable safety certification are verified.
- A representative pilot zone and post-installation measurement plan are included for major projects.
A better procurement question
Instead of asking only, “What is the wattage or maximum PPFD?”, ask the supplier to provide the exact test report, spectral data, a PPFD layout for the intended geometry, electrical details, certification scope, and the assumptions behind every performance claim. That package makes comparisons more transparent and gives the project team a measurable basis for pilot validation.
For an OEM or commercial grow-light project, Number can review the target crop-light plan, mounting geometry, voltage, controls, spectrum and certification requirements before recommending a fixture configuration. Final suitability should be confirmed through project-specific engineering and on-site measurement.
Primary references
ANSI/ASABE S640 overview: Quantities and Units of Electromagnetic Radiation for Plants
DesignLights Consortium: Technical Requirements for LED-based Horticultural Lighting V4.0
UL Solutions: Horticultural Lighting Testing and Certification
U.S. Department of Energy: Better Lighting for Agriculture